Online Survey
An online survey available here on the project website was designed to be a digital complement to the open houses, for those who were not able to participate in person and received 555 responses. A short version of the survey gave people a quick opportunity to provide input in 5-10 minutes, and a long version of the survey gave people an opportunity to answer all questions that were asked at the open houses.
Statistically Valid Survey
A statistically valid survey was conducted of a random sample of city residents by mail, phone, and internet to understand and measure Clevelanders’ needs across the city. The 528 responses received exceeded the goal of 500 responses and ensured that the opinions of a representative cross-section of residents–geographically and across demographic groups–were heard. With this sample size, there is 95% confidence that citywide opinions are within 4.3 percentage points of the values shown.
See more about the results of the statistically valid survey below!
Who Took the Statistically Valid Survey?
The demographic and geographic makeup of the statistically valid survey’s respondents closely match that of the city.


The responses were also sorted into seven geographic planning regions.

Key Survey Findings
Close to 2/3 of respondents feel that there are enough parks within walking distance of their home, while less than 1/2 feel there are enough recreation centers.


A little over 40% of respondents think parks are in excellent or good condition, less than 25% for recreation centers.


Top three most important...
Outdoor Facilities
Indoor Facilities
Programs and Activities
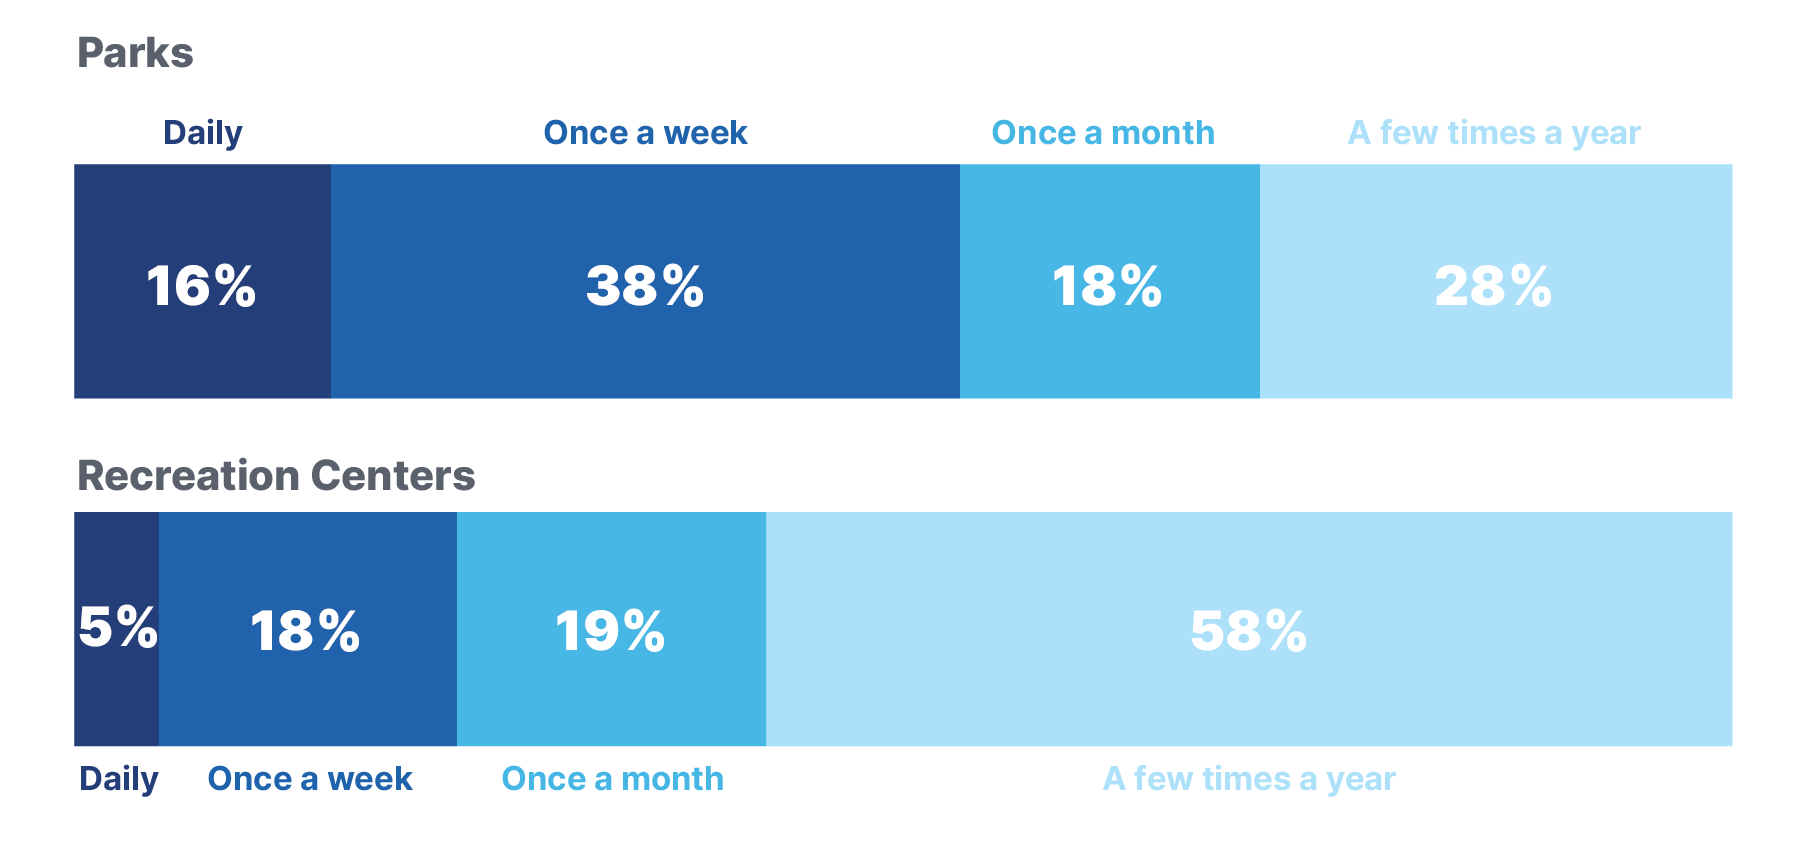
A little over half of respondents visit a park at least once a week, however less than 25% visit a recreation center that often.